FINANCIAL REVIEW
Piramal Enterprises
FY 2022 Revenues: ` 13,993 Crores
Financial Services
FY 2022 Revenue contribution 52%
- RETAIL LENDING
- WHOLESALE LENDING
- ALTERNATIVE ASSETS
- LIFE INSURANCE JOINT VENTURE
Pharma
FY 2022 Revenue contribution 48%
- CDMO
- COMPLEX HOSPITAL GENERICS
- INDIA CONSUMER HEALTHCARE
- JOINT VENTURE WITH ALLERGAN

Total operating income breakup
(` Crores or as stated)
| Net Sales break-up | FY 2022 | FY 2021 | % Change | % Sales for FY 2022 |
|---|---|---|---|---|
| Financial Services | 7,293 | 7,033 | 4% | 52% |
|
Pharma
CDMO Complex Hospital Generics India Consumer Healthcare |
6,701
3,960 2,002 741 |
5,776
3,616 1,669 501 |
16%
10% 20% 48% |
48%
28% 14% 5% |
| Total | 13,993 | 12,809 | 9% | 100% |
Note: Pharma revenue includes foreign exchange gains/losses
Balance Sheet Performance >
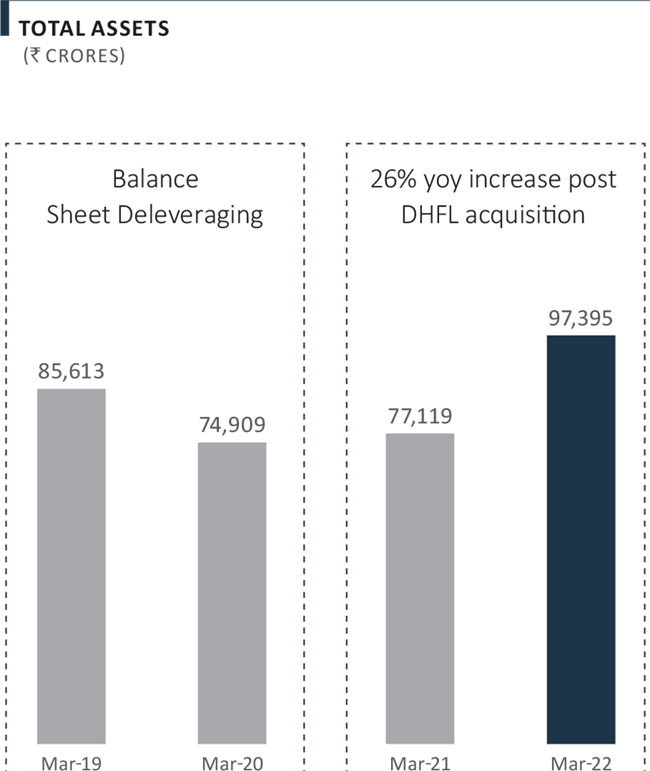
FY 2022 was a transformational year for the Company, marked by the acquisition of DHFL.
Total assets increased 26% yoy to ₹ 97,395 Crores as of March 2022, primarily driven by the DHFL acquisition, completed in September 2021.
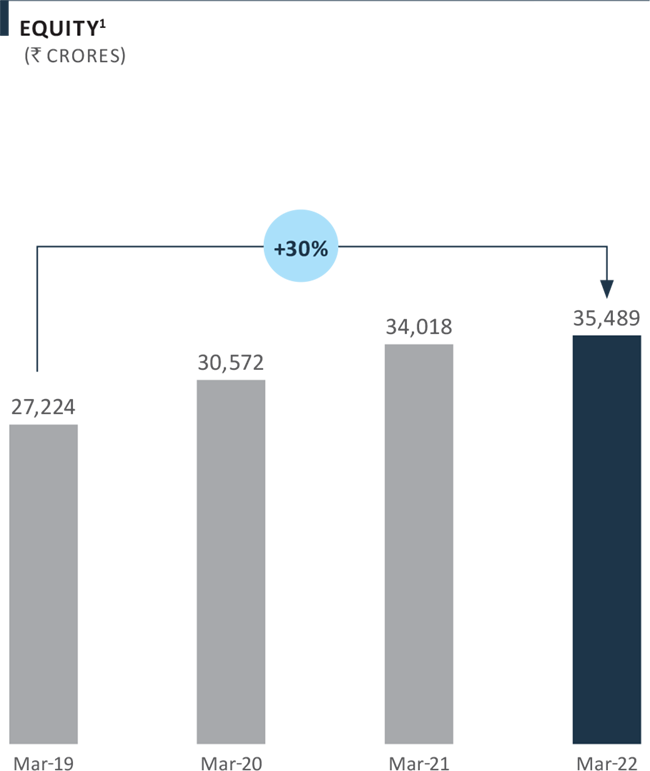
Since FY 2019, the Company has taken several measures to strengthen its balance sheet, including fund raising and balance sheet deleveraging. The Company raised over ₹ 18,000 Crores of equity since the beginning of FY 2019, despite a highly volatile business environment. As a result, the total equity base has increased 30% between March 2019 and March 2022, from ₹27,224 Crores to ₹ 35,489 Crores.

Note:
(1) Excludes non-controlling interest for March 2021 and March 2022
Consolidated balance sheet
(IN ` CRORES)
| Particulars | As on March 31, 2022 | As on March 31, 2021 |
|---|---|---|
| Equity Share Capital | 48 | 48 |
| Other Equity | 35,441 | 33,973 |
| Non-controlling Interests | 1,348 | 1,121 |
| Borrowings (Current & Non-current) | 52,953 | 39,369 |
| Deferred Tax Liabilities (Net) | 192 | 223 |
| Other Liabilities | 7,200 | 2,192 |
| Provisions | 213 | 196 |
| Total | 97,395 | 77,119 |
| PPE, Intangibles (Under Development), CWIP | 7,691 | 6,084 |
| Goodwill on Consolidation | 1,295 | 1,114 |
|
Financial Assets
Investment Others |
24,857 39,466 |
22,029 29,205 |
| Other Non-current Assets | 1,295 | 1,444 |
| Deferred Tax Asset (Net) | 1,368 | 937 |
|
Current Assets
Inventories Trade Receivable Cash & Cash Equivalents & Other Bank balances Other Financial & Non-financial Assets |
1,533 1,621 7,185 11,084 |
1,299 1,545 7,025 6,437 |
| Total | 97,395 | 77,119 |
Note: The above numbers have been regrouped from IND AS Financial Statements for presentation purposes only
Equity
The net worth as on March 31, 2022, increased to ₹ 35,489 Crores from ₹ 34,018 Crores as of March 31, 2021, primarily due to earnings accretion during the year.
As of March 31, 2022, the Financial Services (Lending) business had an equity base of ₹ 17,006 Crores, the Alternatives business had ₹ 1,381 Crores and the Life Insurance business (JV with Prudential International Insurance Holdings) had ₹ 957 Crores. The Pharma business has an equity base of ₹ 5,385 Crores (excluding noncontrolling interest of ₹ 1,348 Crores). Additionally, there is an unallocated equity pool of ₹ 10,760 Crores available, comprising of investments in Shriram and cash and bank balances.
Borrowings
Total borrowings increased to ₹ 52,953 Crores as on March 31, 2022, as compared to ₹ 39,369 Crores as on March 31, 2021. The yoy increase in overall borrowings was primarily on account of the DHFL acquisition, which was funded via 10-year NCDs amounting to ₹ ~19,550 Crores at 6.75% p.a.
Debt to equity
For the Financial Services business, the acquisition of DHFL has resulted in improved capital utilisation, post significant deleveraging of the balance sheet in the prior years. The net debt-to-equity of the Financial Services (Lending) business has increased from 1.8x as of March 31, 2021 to 2.7x as of March 31, 2022. At the PEL-level, net debt-to-equity increased from 0.9x as of March 31, 2021 to 1.2x as of March 31, 2022.
AUM
AUM increased to ₹ 65,185 Crores as on March 31, 2022, as compared to ₹ 48,891 Crores as on March 31, 2021, primarily driven by the acquisition of DHFL. However, this was partly offset by a reduction in the wholesale loan book, which was in line with the Company’s stated strategy of making this book more granular and diversified.
Cash and cash equivalents
Cash and cash equivalents stood at ₹ 7,185 Crores as on March 31, 2022 vis-à-vis ₹ 7,025 Crores as on March 31, 2021.
OVERALL EQUITY
(IN ` CRORES)

Overall Equity1:
` 35,489 Cr.
Pharma1:15%
Built a differentiated business, valued at an EV of $ 2,775 Million in Jun-2020
Financial Services (Lending): 48%
Capital Adequacy Ratio of 21%
Alternatives: 4%
Commitment of ~$ 1 Billion; partnership with marquee institutions
Life Insurance: 3%
Joint Venture (JV) with prudential international insurance holding
Unallocated equity: 30%
Includes investments in Shriram, cash & cash equivalents and others

Note:
(1) Excludes Non-controlling Interest (NCI) of ` 1,348 Crores.
Profit and Loss >
PEL delivered a resilient performance in FY 2022 despite a challenging business environment amidst the 2nd and 3rd wave of the COVID-19 pandemic in India. Consolidated revenues increased 9% yoy to ₹ 13,993 Crores in FY2022 from ₹ 12,809 Crores in FY 2021. Revenues generated in foreign currencies constituted ~39% of the Company’s FY 2022 revenues.

Business-wise revenues
Financial Services
Income from the Financial Services business increased 4% yoy to ₹ 7,293 Crores in FY 2022, as compared to ₹ 7,033 Crores in the previous year. The yoy increase was primarily driven by an increase in AUM on account of the DHFL acquisition, which was partly offset by interest reversals and a reduction in the wholesale loan book, in line with the Company’s stated strategy to make the business more retail oriented.
Pharma
Revenues for the Pharma business increased by 16% yoy to ₹ 6,701 Crores in FY 2022 from ₹ 5,776 Crores in FY 2022. The increase was driven by revenue growth across all Pharma businesses – 10% yoy in Pharma CDMO, 20% yoy in Pharma CHG and 48% yoy in India Consumer Healthcare. Pharma contributed 48% to PEL’s overall consolidated revenues in FY2022. The pharma business delivered an EBITDA margin of 18% during the year.
Consolidated P&L Statement
(` CRORE OR AS STATED)
| FULL YEAR ENDED | |||
|---|---|---|---|
| Particulars | 31-Mar-22 | 31-Mar-21 | % Change |
| NET SALES | 13,993 | 12,809 | 9% |
| Non-operating Other Income | 720 | 364 | 98% |
| Total Income | 14,713 | 13,173 | 12% |
| Other Operating Expenses | 6,847 | 5,335 | 28% |
| Impairment on financial assets | 696 | 10 | - |
| OPBIDTA | 7,170 | 7,828 | -8% |
| Interest Expenses | 4,480 | 4,209 | 6% |
| Depreciation | 666 | 561 | 19% |
| PROFIT / (LOSS) BEFORE TAX & EXCEPTIONAL ITEMS | 2,025 | 3,058 | -34% |
| Exceptional items (Expenses)/Income | -168 | 59 | - |
| Income tax – Current tax | 511 | 785 | -35% |
| DTA reversal / Other One-Time Tax Adjustments | - | 1,258 | -100% |
| PROFIT / (LOSS) AFTER TAX (BEFORE PRIOR PERIOD ITEMS) | 1,346 | 1,074 | 25% |
| Share of Associates1 | 653 | 338 | -93% |
| NET PROFIT / (LOSS) AFTER TAX FROM CONTINUING OPERATIONS | 1,999 | 1,413 | 41% |
Notes:
(1) Income under share of associates primarily includes the Company's share of profits at Shriram Capital and profit under JV with Allergan, as per the accounting standards.
(2) The above numbers have been regrouped from IND AS Financial Statements for presentation purposes only
Finance costs
Finance costs for FY 2022 increased 6% yoy to ₹ 4,480 Crores from ₹ 4,209 Crores in FY 2021, due to an increase in overall borrowings on account of the DHFL acquisition, which was funded via 10-year NCDs amounting to ₹ 19,550 Crores at 6.75% p.a.
However, the increase in total finance costs was partly offset by a decline in the average cost of borrowings, particularly for the Financial Services business. The average cost of borrowings for the Financial Services business declined 170 basis points yoy in Q4 FY 2022 to 9.2%.
Impairment on financial assets
For FY 2022, the impairment on financial assets increased to ₹ 696 Crores from ₹ 10 Crores in FY 2021. The yoy increase was primarily driven by an additional provisioning of ₹ 822 Crores, created in Q4 FY 2022 against non-real estate exposures in Stage-2 upon re‑evaluation of the wholesale portfolio. However, this was partly offset of recoveries worth ₹261 Crores from the retail POCI book-.
Operating expenses
Operating expenses increased 28% yoy to ₹ 6,847 Crores in FY 2022 from ₹ 5,335 Crores in FY 2021, primarily due to expenses associated with the acquisition of DHFL (including higher employee costs and transaction-related expenses) in the Financial Services business, increase in purchases of stock-in-trade and higher advertising and business promotion expenses in the Pharma business.
Income from share of associates
The share of net profit of associates and joint ventures increased 93% yoy to ₹ 653 Crores in FY 2022 from ₹ 338 Crores in FY 2021. This primarily includes the Company’s share of profits in Shriram Capital and the profit under JV with Allergan, accounted for using the equity method.
Depreciation and amortisation
Depreciation and amortisation expense for the year increased to ₹ 666 Crores as compared to ₹ 561 Crores in FY 2021, primarily due to higher depreciation at Pharma overseas entities, on account of additions to plant machinery and the entities acquired during the year.
Net profit after tax
Reported net profit after tax for FY 2022 stood at ₹ 1,999 Crores, as compared to ₹ 1,413 Cores in FY 2021. In FY 2022, the net profit was primarily impacted due to an additional provisioning of ₹ 822 Crores and an interest reversal of ₹ 215 Crores (totalling ₹ 1,037 Crores), whereas, the previous year was impacted by the reversal of deferred tax assets of ₹ 1,258 Crores.
Dividend
The Board has recommended a dividend of ₹ 33 per share, subject to approval of the shareholders at the Annual General Meeting. The total dividend payout on this account would be ₹ ~788 Crores (dividend payout ratio of 39%).